
Figure 5. General neurological tests do not reveal effects of HCN1 deletion from Purkinje cells.
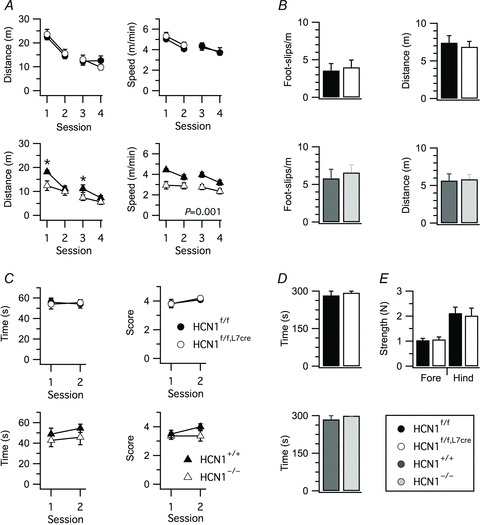
A, distance travelled and movement speed in an open field, plotted as a function of test session. Locomotor activity was not affected by HCN1 deletion in HCN1f/f,L7Cre mice (distance, genotype X session F3,90= 1.87, P= 0.14; speed, genotype X session F3,90= 0.47, P= 0.71, n= 15–17/group, two-way ANOVA), whereas locomotor activity of HCN1−/− mice was reduced compared to HCN1+/+ mice (distance, genotype F1,22= 3.88, P= 0.06; genotype X session F3,66= 2.91, P= 0.04; mean speed, genotype F1,22= 13.59, P= 0.001; genotype X session F3,66= 1.84, P= 0.15, n= 11–13/group). B, foot slips and distance travelled in a parallel rod floor test did not differ significantly between HCN1f/f and HCN1f/f,L7Cre mice (t30= 0.95, P= 0.35 and t30= 0.66, P= 0.51, respectively, n= 15–17, Student's unpaired t test) or between HCN1−/− and HCN1+/+ mice (t22= 0.48, P= 0.63 and t22= 0.63, P= 0.53, n= 11–13). C, time spent hanging on to a suspended wire and score plotted as a function of session. Performance was not significantly affected by deletion of HCN1 from Purkinje cells (time, genotype X session F1,18= 0.12, P= 0.73; score, genotype X session F1,18= 0.06, P= 0.81, n= 10, two-way ANOVA) or by global deletion of HCN1 (time, genotype X session F1,21= 0.06, P= 0.82; score, genotype X session F1,21= 1.2, P= 0.8228, n= 11–12). D, time spent hanging on to a grid in the inverted grid test. No differences were observed between HCN1f/f and HCN1f/f,L7Cre mice (t18= 1, P= 0.33, Student's unpaired t test) and between HCN1+/+ and HCN1−/− mice (t21= 0.59, P= 0.56). E, Purkinje cell-specific HCN1 deletion did not affect grip strength (forelimbs, t28= 0.27, P= 0.79; hindlimbs, t28= 0.26, P= 0.8, n= 15, Student's unpaired t test). Data are presented as mean ± SEM; *P < 0.05 control (HCN1f/f or HCN1+/+) versus knock-out (HCN1f/f,Cre or HCN1−/−), Fisher's PLSD.