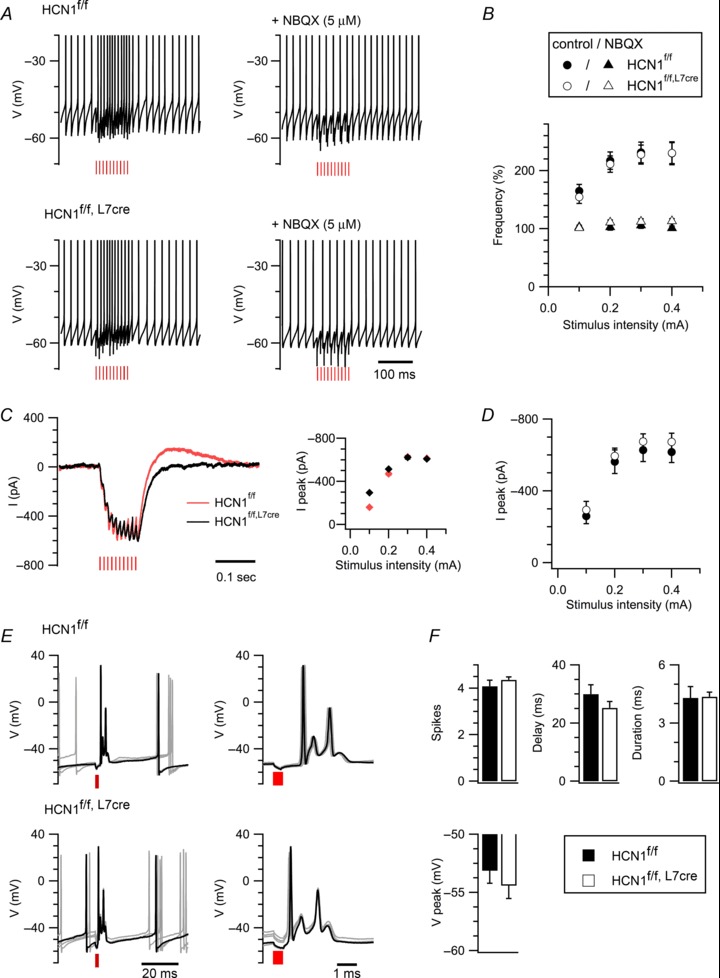
Figure 6. Excitatory synaptic input is not modified by deletion of HCN1 from Purkinje cells.

A, responses (left) of Purkinje cells from HCN1f/f (upper) and HCN1f/f,L7Cre mice (lower) to activation of parallel fibres with 10 stimuli at 100 Hz (0.3 mA) are abolished by the GluA antagonist NBQX (right). Action potentials are truncated. B, action potential frequency during parallel fibre stimulation is plotted as a function of stimulus intensity (genotype F1,22= 0.06, P= 0.8; genotype X stimulus intensity F3,66= 0.13, P= 0.94, n= 10–14/group; NBQX F1,14= 85.68, P= 0.0001; genotype X stimulus intensity X NBQX F3,42= 0.09, P= 0.97, n= 7–9, two-way ANOVA). C, examples of membrane currents recorded in voltage-clamp from HCN1f/f and HCN1f/f,Cre Purkinje cells in response to parallel fibre stimulation. Each trace is the pharmacologically isolated GluA current, measured as the difference between the recordings from the same cell in the absence and in the presence of NBQX. The graph plots the peak current as a function of stimulus intensity. Cells were voltage-clamped at –75 mV. The rebound outward current at the end of the train reflects activation of Ih during the train, most likely because of imperfect voltage-clamp. D, the peak current in response to parallel fibre stimulation was similar in HCN1f/f and HCN1f/f,L7Cre mice (genotype F1,16= 0.36, P= 0.56; genotype X stimulus intensity F3,48= 0.11, P= 0.95, n= 8–10, two-way ANOVA). E, examples of complex spike responses of Purkinje cells from HCN1f/f and HCN1f/f,L7Cre mice following stimulation of climbing fibres. On the right the complex spikes are plotted on an extended time scale. F, the number of spikes within the complex spike (t11= 0.28, P= 0.31, Student's unpaired t test), the duration of the pause in spontaneous firing following a complex spike (t11= 4.72, P= 0.23), the duration of the complex spike (t11= 0.12, P= 0.91) and the peak hyperpolarization after a complex spike (t11= 0.78, P= 0.45) were similar in HCN1f/f and HCN1f/f,L7Cre mice (n= 5–8). Red vertical lines denote stimulation. Data are presented as mean ± SEM.
