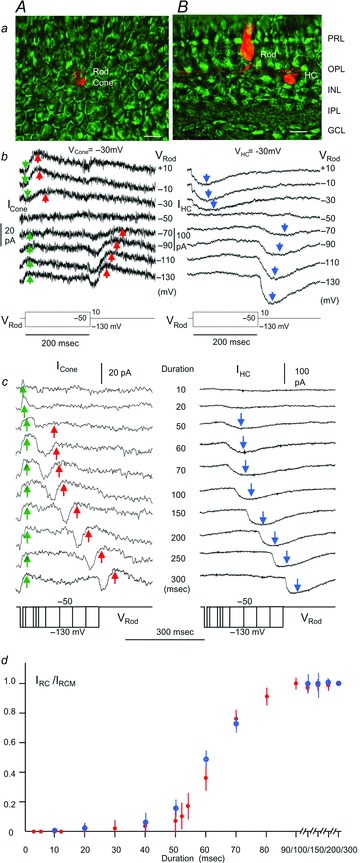
Figure 5. Response waveforms and time course of IRC and IHC.

A, rod–large single cone pair; B, rod–HCB pair. Panel a, Lucifer Yellow fluorescent images of a rod–cone pair in the flat-mounted retina (A) and a rod–HC pair in the living retinal slice (B). Calibration bars, 20 μm. Panel b, current responses of the cone (ICone, held near its dark potential at −30 mV; A) and current responses of the HC (IHC, held near its dark potential at −20 mV; B) to the same set of voltage clamp steps in rods (VRod, −130 to +10 mV). Blue arrows, IHC; green arrows, Ij; red arrows, IRC. Panel c, current responses of a large single cone cone (ICone, held near its dark potential at −30 mV; A), and current responses of a HCB (IHC, held near its dark potential at −20 mV; B) to the same set of negative voltage clamp steps (−50 to −130 mV) of various durations (10 –300 ms) in rods. Red arrows, IRC; blue arrows, IHC. IRC is accompanied by a sustained Ij (green arrows) whereas IHC is not. The red and blue arrows mark the same time points of each IRC and IHC response pairs, showing that IRC and IHC peak approximately at the same times. Panel d, normalized, average (error bars =±SD, N = 11 for rod–cone pairs and 6 for rod–HCB pairs) amplitude–duration plots of IRC (red filled circles) and IHC (blue open circles).
