
Figure 3. Glial cells do not exhibit voltage shifts in response to LFS.
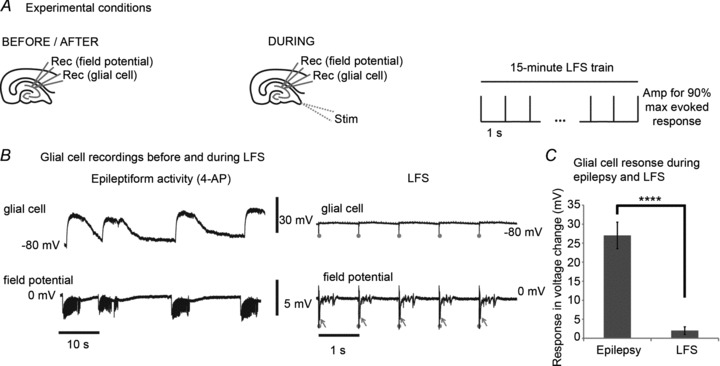
A, intracellular recordings were obtained from 10 glial cells bathed in 4-AP (100 μm) before and during a 15 min 1 Hz LFS train. Simultaneous field potential recordings were obtained from CA1. B, prior to LFS, glial cells showed marked depolarization that correlated with ictal epochs recorded from field potentials. During LFS, glial cells did not exhibit appreciable voltage changes. In contrast, hyperactive evoked field potentials that are typical in 4-AP were reliably recruited by each stimulus. Stimuli are marked by grey dots and the evoked potentials are shown by arrows. C, the glial cell responses, measured as voltage change in mV, during epilepsy and LFS are compared. There is a significant difference (P < 0.0001, Student's paired t test) between the glial cell response to epilepsy and to LFS. Bar graphs represent data means ± SD. ****P < 0.0001.