
Figure 4. LFS changes the distribution of inter-stimulus activity.
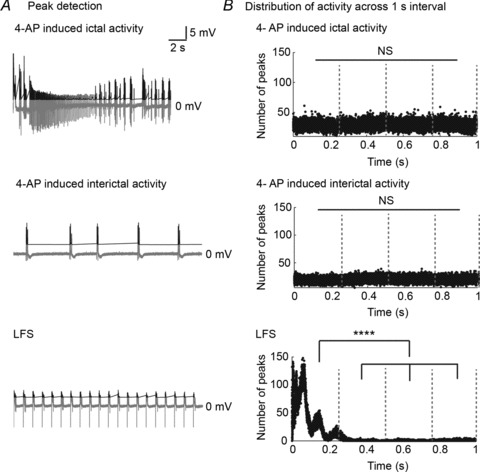
Epileptic activity is recorded extracellularly from left and right CA3/CA1 after which LFS is applied to the VHC (15 min each) as shown in Fig. 1B. A, 20 s of a 4-AP-induced ictal epoch (top panel), interictal epoch (middle panel) and LFS (bottom panel) are shown (grey traces). Field potential peaks were detected in each case if they were greater than 1 standard deviation from the mean height, as shown (black traces). B, the distribution of peaks across a 1 s interval from 1000 s in total (50 s randomly selected from 20 slices) of ictal recordings (top panel), interictal recordings (middle panel) and recordings during 1 Hz LFS (bottom panel) is shown. Sorting into 1 s intervals begins at the first ictal or interictal spike detected, respectively, or at the stimulus artifact, where applicable. There is no significant difference in number of ictal or interictal peaks across four equal time-blocks of the ISI (P > 0.05, ANOVA). During LFS, more peaks occur during the first part of the ISI (P < 0.0001, ANOVA; post hoc analysis using Tukey-Kramer). ****P < 0.0001.