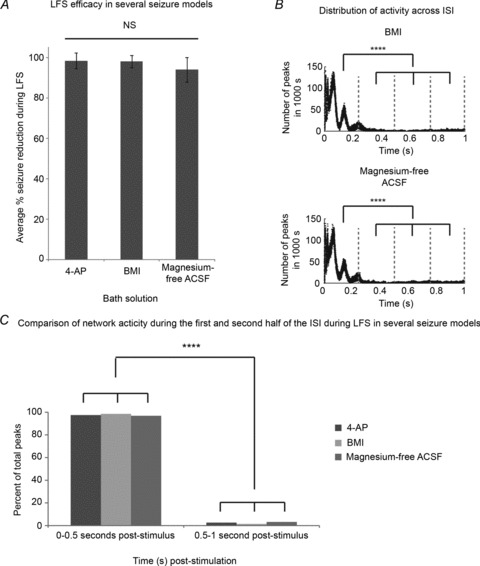
Figure 5. LFS changes the distribution of inter-stimulus activity in several epilepsy models.

Trains of 15 min 1 Hz LFS were applied to bilateral hippocampi–VHC slices after recording baseline epileptic activity for at least 15 min as shown in Fig. 1B in either 4-AP (100 μm), bicuculline methiodide (BMI, 10 μm), or magnesium-free ACSF. A, LFS efficacy is not different in three distinct seizure models (P= 0.682, ANOVA). Seizure reduction during electrical stimulation across groups is distributed as follows (n= 14, 9 and 5, respectively): 97%± 8% in 100 μm 4-AP; 97%± 6% in 10 μm BMI; and 94%± 12% in magnesium-free ACSF. B, the distribution of peaks across the 1 s inter-stimulus intervals (ISI) from 1000 s (50 s randomly selected from 20 slices) of recordings during 1 Hz LFS in BMI (top panel) and magnesium-free LFS (bottom panel) are shown. Sorting into 1 s intervals begins at each stimulus artifact. During LFS, more peaks occur during the first part of the ISI (P < 0.0001, ANOVA; post hoc analysis using Tukey-Kramer) in each of these seizure models. C, the percentage of total peaks that occur in the first and second half of the ISI during 1 Hz LFS is shown for each of the three distinct epilepsy models. There are no significant differences between percentage of total peaks per half of the ISI between the three different epilepsy models (P > 0.5, ANOVA). Therefore, the percentages of total peaks per half of the ISI were averaged across models and compared. On average across models, 99 ± 0% of peaks occur within the first half of the ISI in these seizure models where LFS is effective. This is significantly different from the 1 ± 1% of peaks that occur in the second half of the ISI during LFS in these models (P < 0.0001, Student's t test). ****P < 0.0001.
