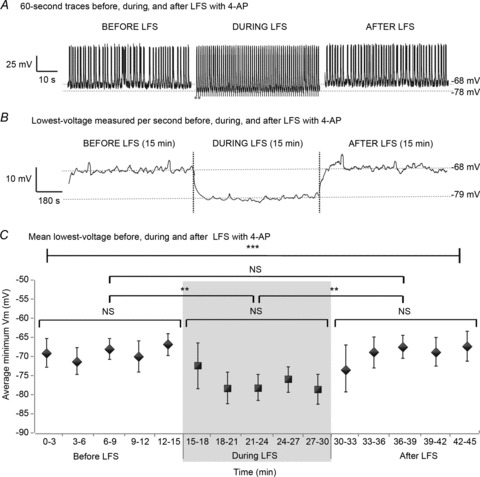
Figure 6. LFS induces hyperpolarization during application.

Trians of 15 min 1 Hz LFS were applied to bilateral hippocampi–VHC slices after recording baseline epileptic activity for at least 15 min as shown in Fig. 1B in 4-AP (100 μm). A, 60 s of representative activity recorded intracellularly from CA1 in 4-AP before (left), during (middle) and after (right) LFS are shown. Stimuli are marked by grey dots. During LFS, cells appear to reach more negative voltages than at baseline. B, the minimum Vm per second was determined before, during and after LFS (15 min each) for each sample (n= 18) and is shown across the entire 45 min experiment period for 1 slice. C, the mean ± SD of minimum Vm before, during and after LFS (15 min each) was determined every 3 min for each slice and averaged across 18 slices. There is a significant difference in the average minimum Vm during stimulation compared to before or after LFS (P < 0.005, ANOVA). Post hoc analysis using the Tukey test shows that average minimum Vm is reduced during LFS, but is the same before and after LFS (LSD = 5.37, P < 0.05 and 7.19, P < 0.01). Box plots represent data means ± SD. **P < 0.01; ***P < 0.001.
