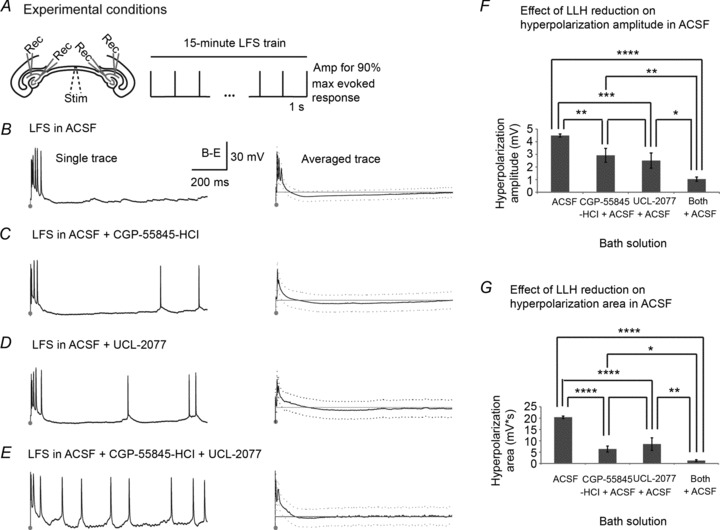
Figure 7. GABAB/sAHP antagonists decrease stimulus-induced long-lasting hyperpolarization in non-epileptic slices.

A, 1 Hz LFS was applied to the VHC of bilateral hippocampi–VHC slices while recording intracellularly from bilateral CA3/CA1 pyramidal cells in either (1) ACSF (n= 7); (2) CGP-55845-HCl (1 μm) in ACSF (n= 8); (3) UCL-2077 (10 μm) in ACSF (n= 7); or (4) both CGP-55845-HCl + UCL-2077 in ACSF (n= 6). B–E, a single trace showing evoked as well as non-evoked activity that occurs in the inter-stimulus interval (ISI) during 1 Hz electrical stimulation in each solution is shown in the left column. Traces are 1 s with stimulation marked by dots. For each solution, averaged traces (continuous line) ± SD (dotted line) with sample mean resting potentials (grey line) are shown in the right column. F, peak hyperpolarization amplitudes in each solution are measured as the lowest voltage of the averaged signal in the ISI after 100 ms per slice minus the resting potential of that cell. The mean hyperpolarization amplitudes across slices per solution are: (1) 4.5 ± 0.3 mV; (2) 2.9 ± 1.1 mV; (3) 2.5 ± 1.2 mV; and (4) 1.0 ± 0.3 mV for (1) ACSF; (2) CGP-55845-HCl in ACSF; (3) UCL-2077 in ACSF; and (4) both CGP-55845-HCl + UCL-2077 in ACSF, respectively, which are significantly different (P < 0.0001, ANOVA, LSD (Tukey-Kramer) at P < 0.01 = 1.5 mV). G, hyperpolarization area is measured in each solution as the sum of the averaged voltage potentials lower than the resting potential in the ISI minus the resting potential of that cell. The mean hyperpolarization areas across slices per solution are: (1) 20.4 ± 1.1 mV s; (2) 6.4 ± 2.6 mV s; (3) 8.6 ± 5.5 mV s; and (4) 1.3 ± 0.8 mV s for (1) ACSF; (2) CGP-55845-HCl in ACSF; (3) UCL-2077 in ACSF; and (4) both CGP-55845-HCl + UCL-2077 in ACSF, respectively, which are significantly different (P < 0.0001 using ANOVA, LSD (Tukey-Kramer) at P < 0.01 = 5.15 mV s). Bar graphs represent data means ± SD. ****P < 0.0001.
