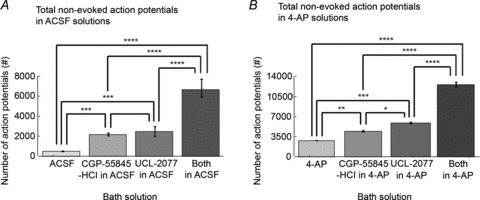
Figure 11. GABAB/sAHP antagonists increase inter-stimulus activity.

Trains of 15 min 1 Hz LFS were applied to the VHC of bilateral hippocampi–VHC slices while recording extracellularly from CA3/CA1 bilaterally as shown in Fig. 7A in either (1) ACSF or 4-AP (100 μm); (2) CGP-55845-HCl (1 μm) + either ACSF only or 4-AP in ACSF; (3) UCL-2077 (10 μm) and either ACSF or 4-AP; or (4) both CGP-55845-HCl + UCL-2077 in either ACSF or 4-AP. The total number of non-evoked action potentials (peaks with magnitude greater than 40 mV that reach a voltage higher than -20 mV) that occur during the LFS train is averaged across slices in all solutions in ACSF (n= 7, 8, 7 and 6, respectively; A) as well as 4-AP (n= 4, 3, 3 and 3, respectively; B). There are significant differences in number of action potentials during LFS between groups in ACSF as well as 4-AP (P < 0.0001 using ANOVA). Differences between pairs of groups are determined using Tukey-Kramer post hoc analysis. Bar graphs represent data means ± SD. *P < 0.05; **P < 0.01; ***P < 0.001; ****P < 0.0001.
