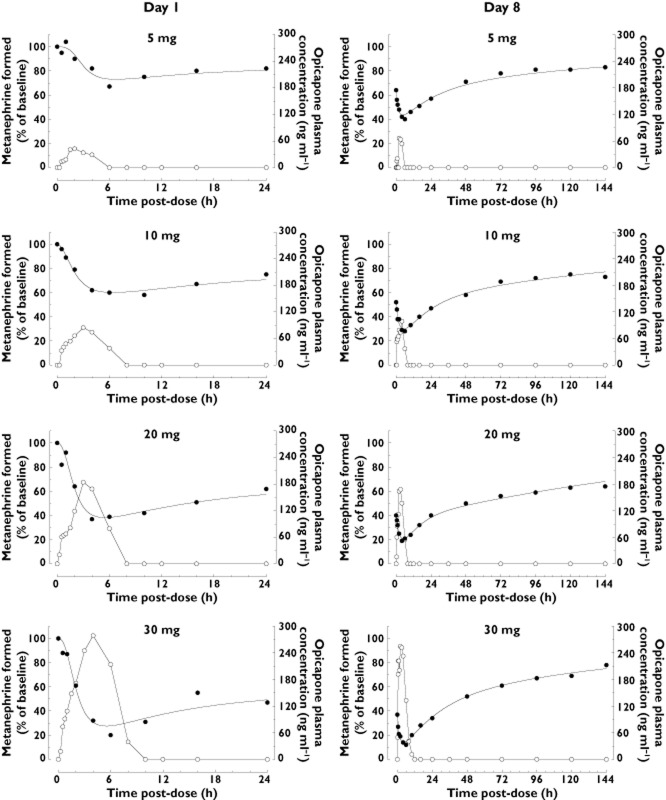
Figure 4.
S-COMT activity (% of baseline, pre-dose day 1, closed symbols) and mean plasma concentration of opicapone (open symbols) versus time, following the first (day 1) and last (day 8) doses of a 8 day once daily regimen with opicapone (n = 6 per dose group of opicapone; n = 7 for placebo). Curves represent best fits of equation 1 with non-linear regressions, using a global value for k2 (see text)

