
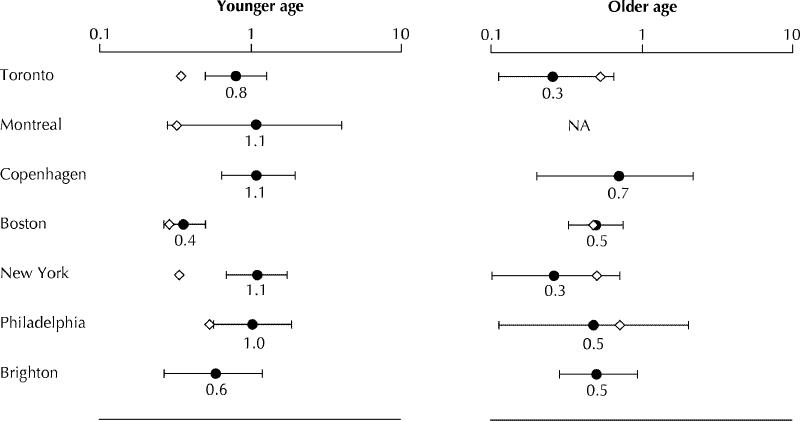
Fig. 2: Rate ratios comparing mortality rates among homeless women and homeless men. Younger and older age groups were defined, respectively, as 16–44 and 45–64 years for the Brighton study; age groups for the other studies are defined in the caption to Fig. 1. Bars indicate the 95% confidence intervals (when available), and open diamonds represent rate ratios comparing mortality rates among women and men in the general population.