
Figure 3.
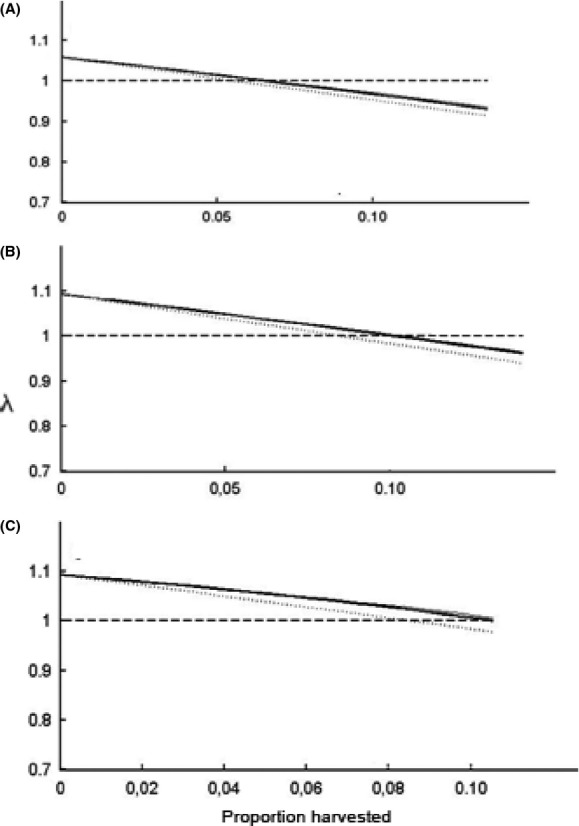
Population growth rate as a function of the proportion of the population harvested under scenario 1 (A), 2 (B), or 3 (C; Table 2). Thin dotted line = growth rate without considering heterogeneity (no compensation); thick solid line = growth rate with compensation for heterogeneity; thin solid line = growth rate with compensation for harvest parameter sensitivity.