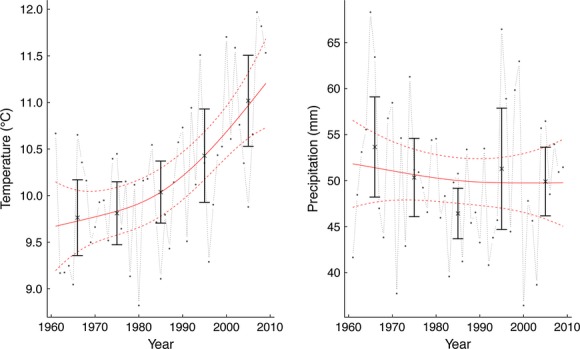
Figure 5.

Trends in temperature and precipitation in Hungary from 1961 to 2009 (and the 95% confidence intervals). The trend for temperature is significant (edf = 1.94, F = 11.73, P < 0.001). The variation in mean yearly temperature has not increased during the time period. Precipitation has not increased over time and variability between years has also not increased over time. For every period of 10 years, the mean and 95% confidence interval were calculated and these are presented in the graphs.
