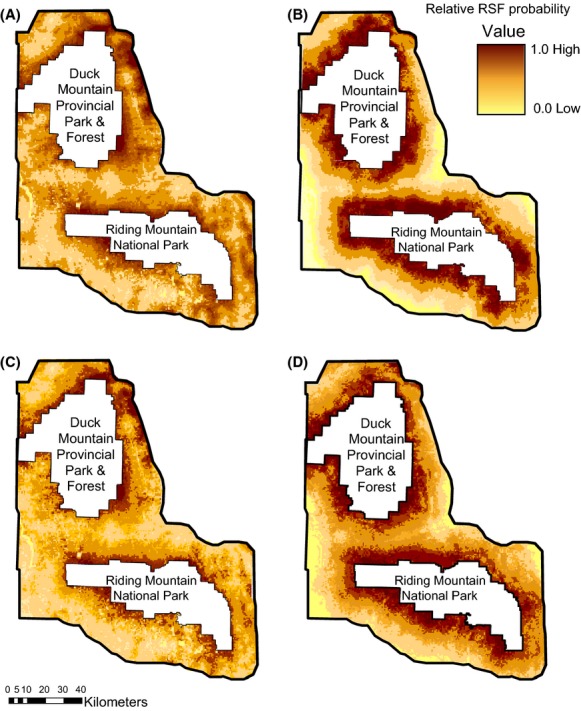
Figure 3.

Interpolated map surfaces representing a resource selection function model for (A) collared adult females, (B) collared juvenile males, (C) hunter-killed adult females, and (D) hunter-killed juvenile males in southwestern Manitoba (September–February; 2002–2012). Darker shaded areas represent a high probability of elk use/kill, whereas lighter shaded areas represent a low probability of elk use/kill.
