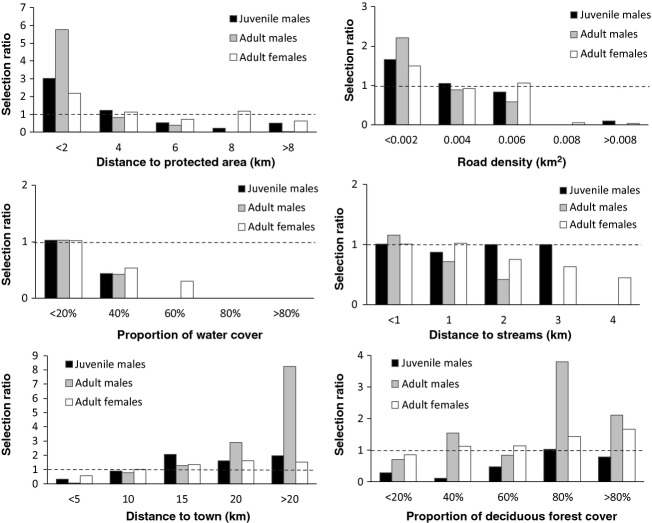
Figure 5.
Selection ratios for the six covariates identified as most important for hunter-killed elk from the resource selection function models during the hunting season (September–February; 2003–2012) in southwestern Manitoba. Values > 1 indicate use is greater than availability, whereas values < 1 indicate use is less than availability.

