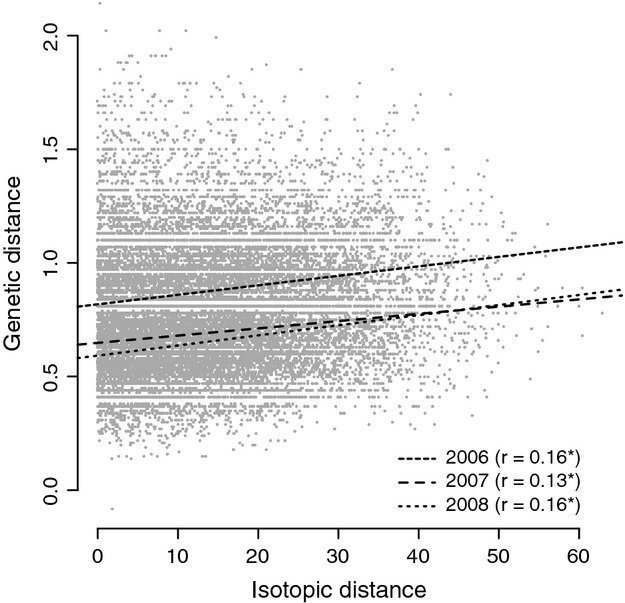
Figure 1.

Correlation between individual genetic distance and delta distance (based on δ2H values). The scatterplot shows individual pairwise distances from all three study years (2006–2008, note that 2006 birds and 2007/2008 birds were not caught at the same site), and the lines denote the positive correlations for each year separately. Numbers in parentheses depict the respective Pearson correlation coefficients (*: all P≪0.01).
