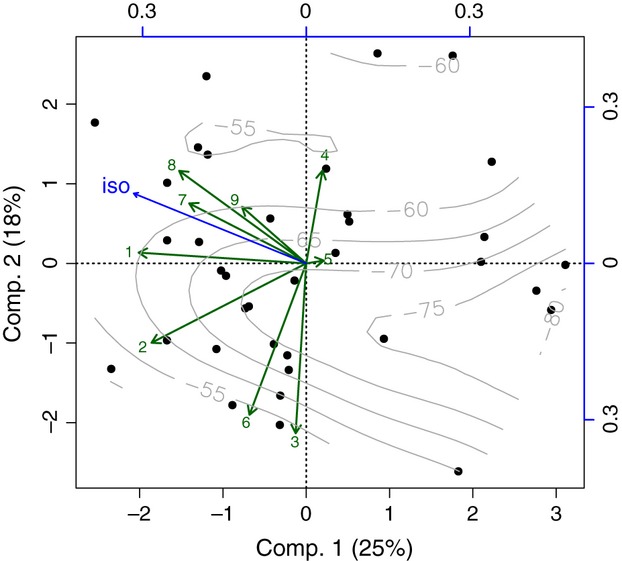
Figure 5.

Habitat choice ordination biplot with δ2H variable response surface overlain in gray and the surface was fitted using a generalized additive model approach. The arrows 1–9 depict the respective habitat variables (see Table 1). The iso-arrow depicts the direct biplot projection for the δ2H variable onto the ordination and indicates the significant association with Comp. 1 but not with Comp. 2.
