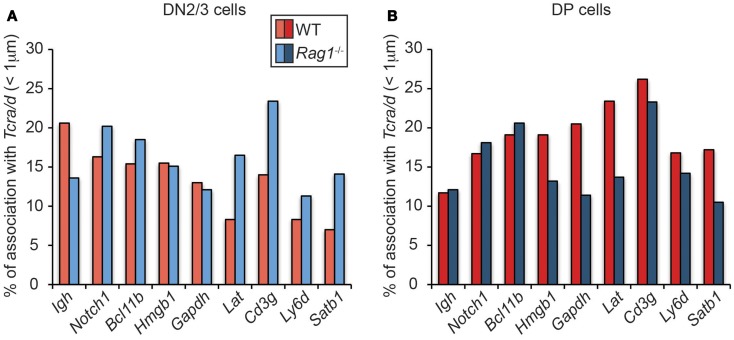
Figure 4.
Dynamics of Tcra association with H3K4me3- enriched active loci in WT and RAG1-deficient DN2/3 and DP cells. DNA FISH was performed using fluorescent BAC probes for Tcra, Igh, and the H3K4me3-enriched active loci, images were recorded on a Leica SP5 confocal and distances were measured in 3-dimension using Image J software. Association was defined as a distance between the two centers of mass under 1 μm in DN2/3 (A) and DP (B) cells.

