
Figure 2. Differentially expressed subnetworks identified by Gene Expression Network Analysis.
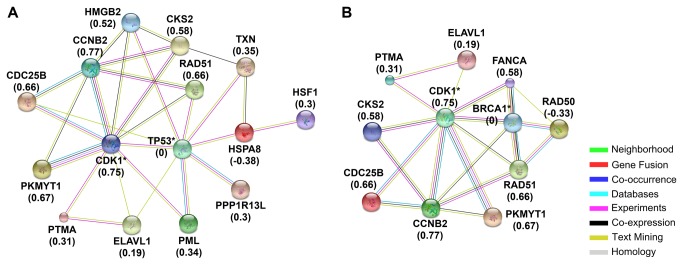
Subnetworks containing p53 (A) and BRCA1 (B) were differentially expressed in AA tumors. Subnetworks were identified using GXNA and visualized using STRING. Starred results were not differentially expressed but were included in the subnetwork by GXNA. Values in parentheses are the mean fold changes of log2-transformed AA expression relative to CA expression, calculated as log2(CA)/log2(AA). Gene names: HMGB2: BRCA1 - breast cancer 1, early onset; CCNB2 - cyclin B2; CDC25B - cell division cycle 25B; CDK1 - cyclin-dependent kinase 1; CKS2 - CDC28 protein kinase regulatory subunit 2; ELAVL1 - ELAV (embryonic lethal, abnormal vision, Drosophila)-like 1 (Hu antigen R); FANCA - Fanconi anemia, complementation group A; HMGB2 - high mobility group box 2; HSF1 - heat shock transcription factor 1; HSPA8 - heat shock 70kDa protein 8; PKMYT1 - protein kinase, membrane. associated tyrosine/threonine 1; PML - promyelocytic leukemia; PPP1R13L - protein phosphatase 1, regulatory subunit 13 like; PTMA - prothymosin, alpha; RAD50 - RAD50 homolog (S. cerevisiae); RAD51 - RAD51 recombinase; TP53 - tumor protein p53; TXN – thioredoxin.