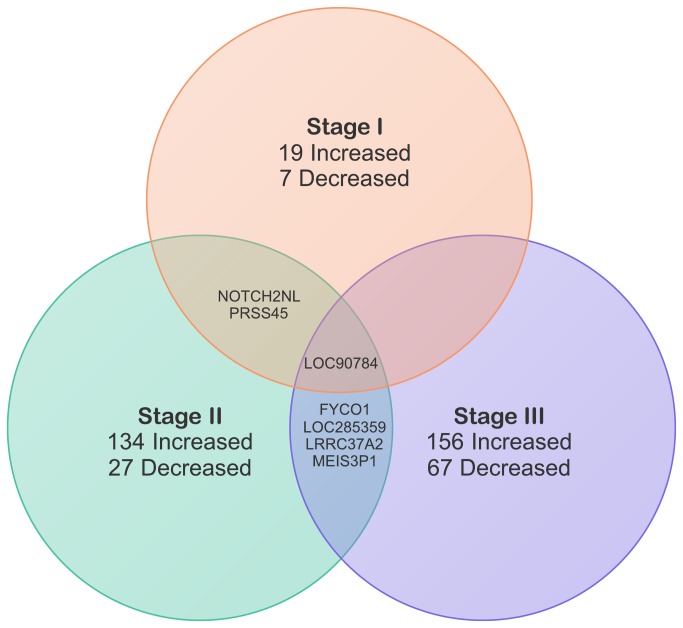
Figure 3. Venn diagram depicting overlap of differentially expressed genes and other transcripts between stage-matched African- and Caucasian-American tumors.
Increases or decreases indicate AA gene expression and are relative to CA expression. Gene names: FYCO1 - FYVE and coiled-coil domain containing 1; LOC90784 - Not Available; LOC285359 - Not Available; LRRC37A2 - leucine rich repeat containing 37, member A2; MEIS3P1 - Meis homeobox 3 pseudogene 1; NOTCH2NL - notch 2 N-terminal like; PRSS45 - protease, serine, 45.

