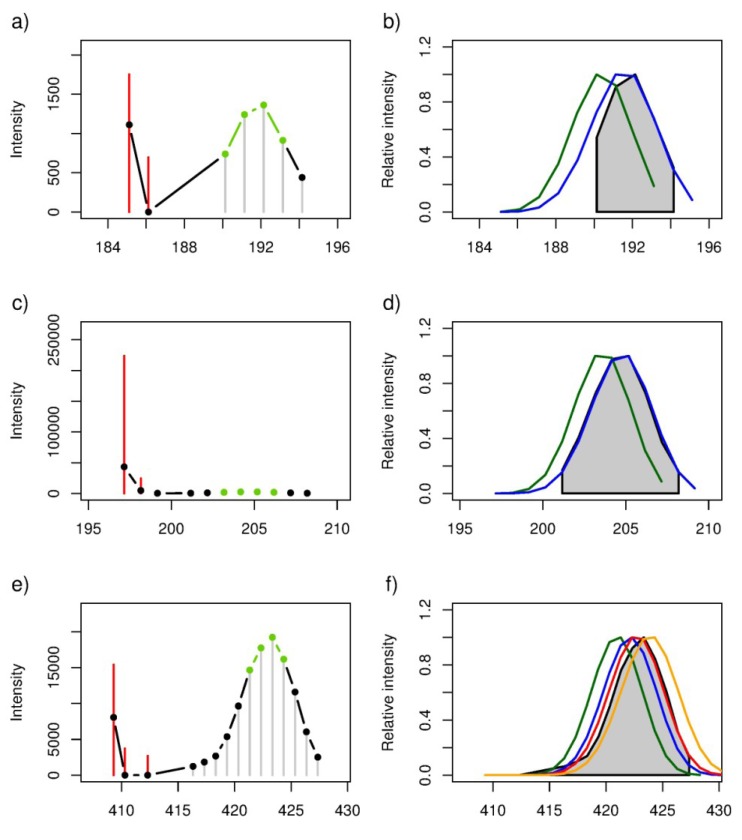
Figure 5.
(a,c,e). Stable isotope patterns observed in DI FT-ICR mass spectra collected from 13C-labelled cultures of Alexandrium tamarense. Signal intensity template presented in green, additional 13C-labelled peaks in black, and isotopic peaks observed in mass spectra of unlabelled A. tamarense samples in red. (b,d,f). Simulated stable isotope patterns (SIPs) were modelled for each empirical formula assignment to the all-12C peak with a labelling efficiency of 58%, where the coloured profiles correspond to differing numbers of carbon atoms in the formula (defined in Table 2). The experimental data for 13C-labelled A. tamarense, identical to that in the plots on the left, are shown in grey. The results of the metabolite annotation are shown in Table 2.

