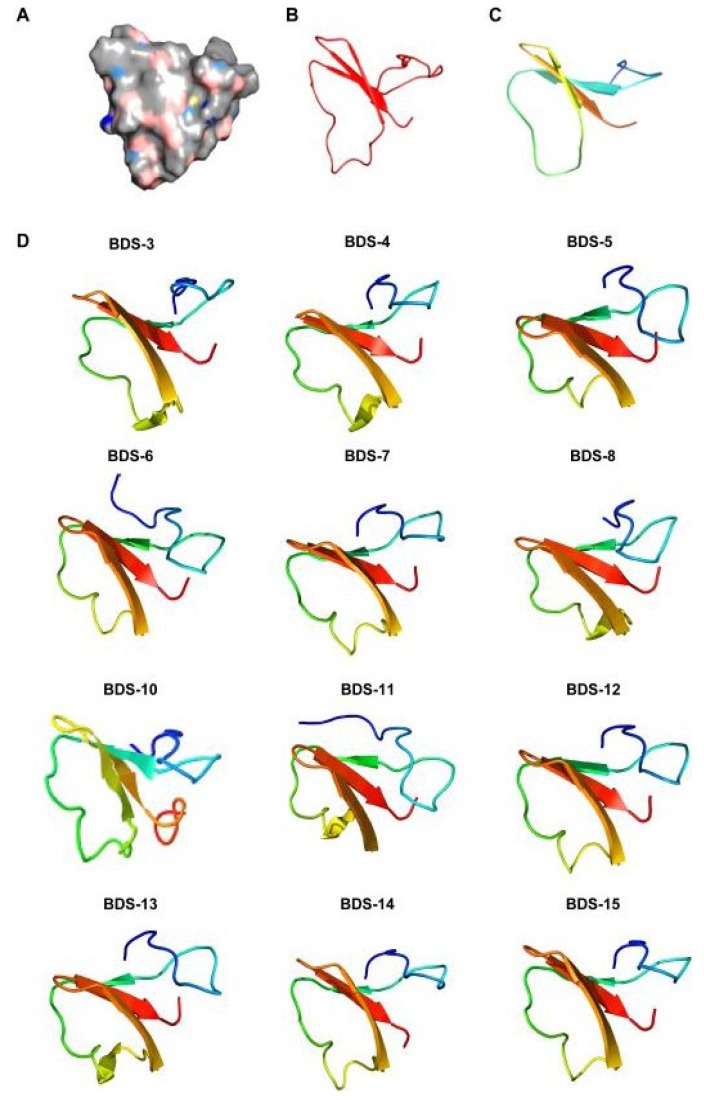
Figure 6.
Homology modelling of BDS toxins. The models were built based on the NMR structure of the mature form of BDS-1. (A) BDS-1 surface in an electrostatic potential model; (B,C) Structural elements of BDS-1 and BDS-2; (D) Structure predictions of the BDS toxins. The colour transition from blue to red represents the transition from the N- to C-terminus.

