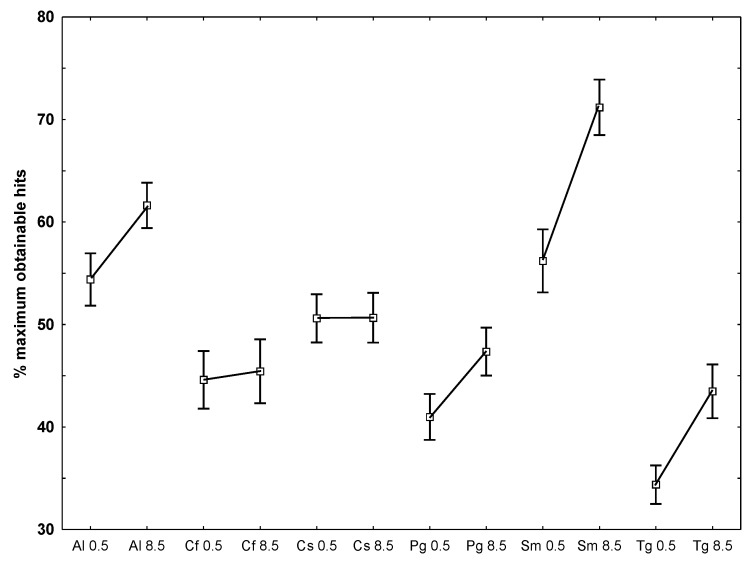
Figure 4.
The number of common markers as a % of the maximum obtainable when each replicate from each species and temperature (0.5 and 8.5 °C) was compared to all other replicates (all species). Vertical bars are ±1 SE and n = 54 for each species-temperature. Lines drawn between points only serve to delineate the species.

