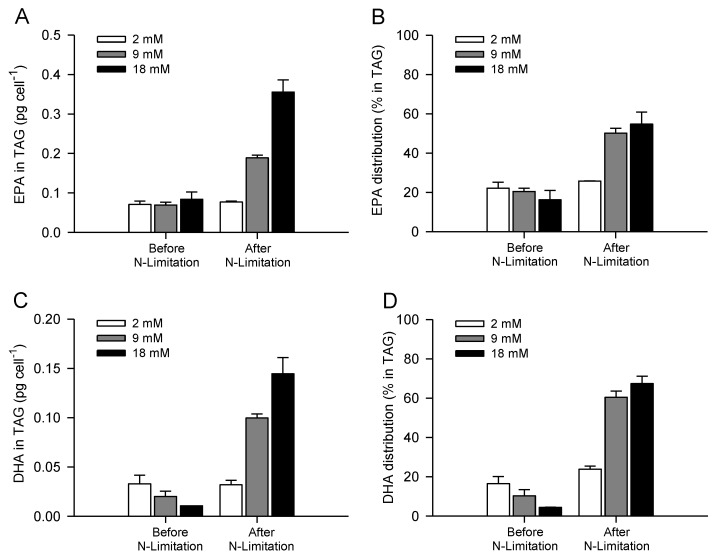
Figure 5.
TAG cellular EPA and DHA (A and C, respectively) contents and overall distribution into TAG (B and D, respectively) before and after nitrogen limitation of batch-cultivated P. lutheri supplemented with different initial bicarbonate concentrations. Results are expressed as the mean ± SD of two replicates (n = 2).

