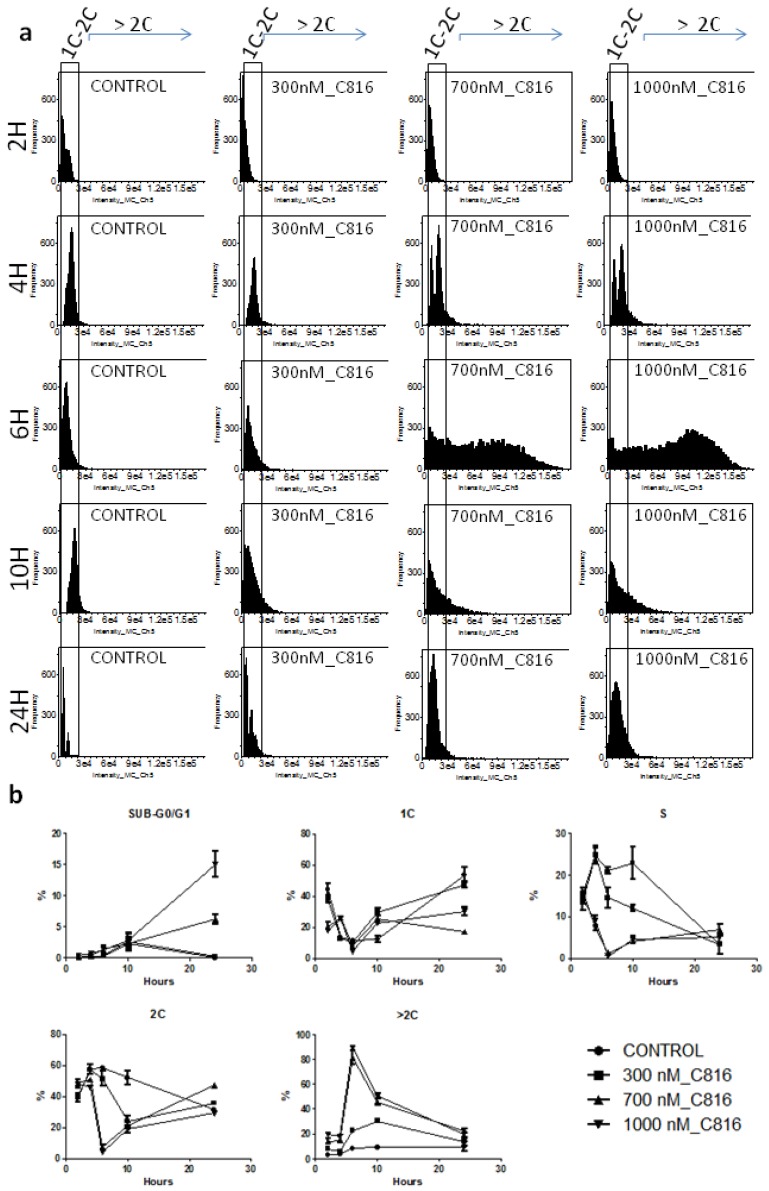
Figure 5.
C816 induces an increase in the DNA content in S. cerevisiae. (a) Histograms obtained after flow cytometry of S. cerevisiae treated with C816 for 2, 4, 6, 10 and 24 h. Marked with a rectangle are the cells with 1C, 2C cell cycle distribution. (b) Analysis of cell population distributions after the different treatments performed. Each treatment was assayed in triplicate, and two experiments were performed. The mean (n = 3) ± SD for each treatment is shown.

