Figure 2.

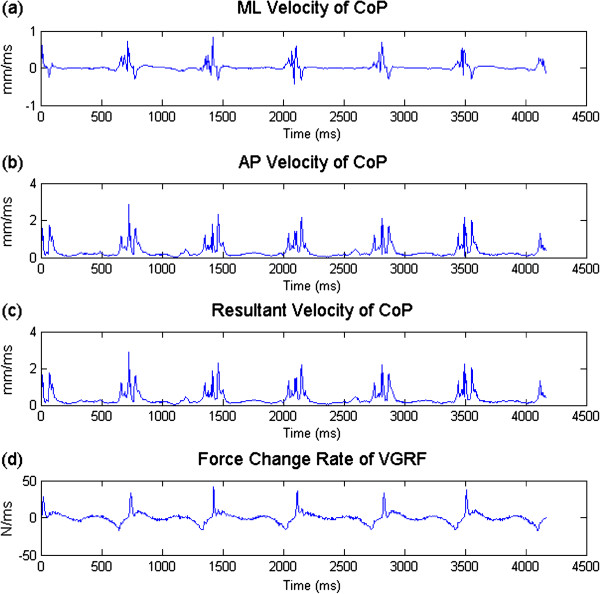
Illustration of ML velocity (a) and AP velocity (b), resultant velocity, (c), and force change rate (d) of one subject with hallux valgus.

Illustration of ML velocity (a) and AP velocity (b), resultant velocity, (c), and force change rate (d) of one subject with hallux valgus.