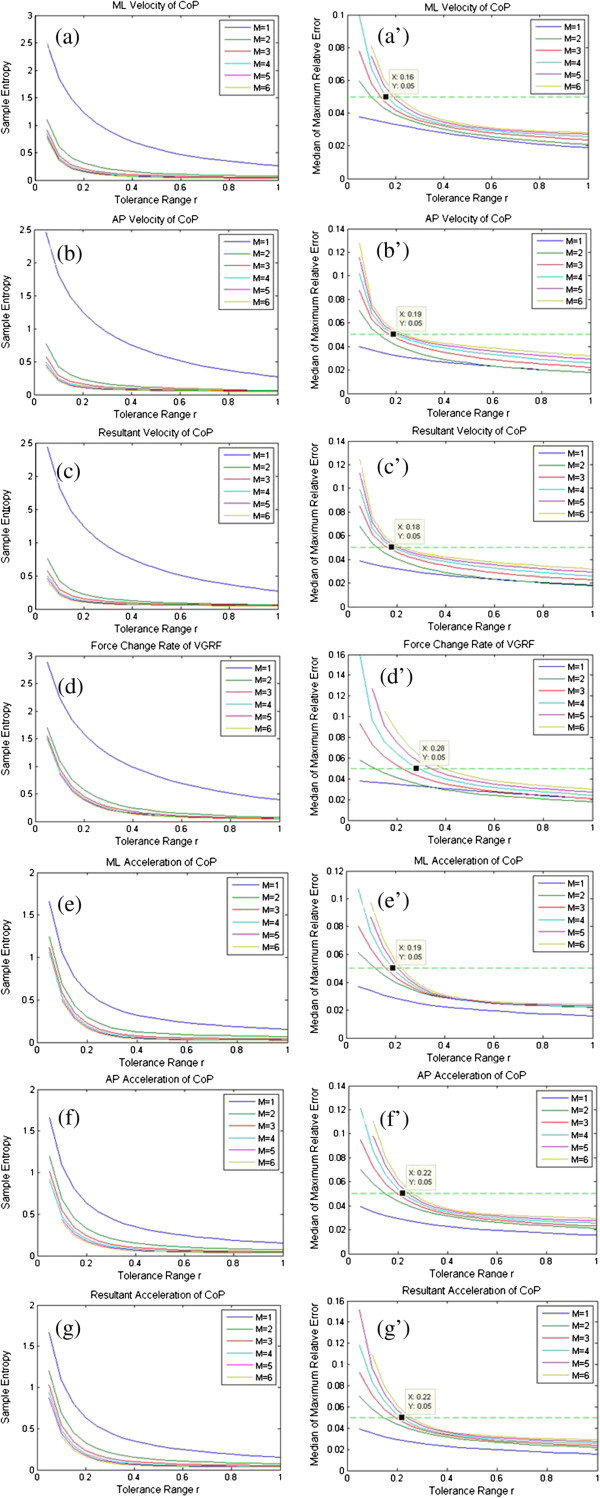
Figure 4.

Optimal selections of parameters m and r. In figures (a)-(g), median sample entropy is calculated over all time series of each variable. When m≥4, the curves converge. In figures (a’)-(g’), medians of maximum relative error that correspond to different m and r values are illustrated. Each r value was determined under the condition that the median of the maximum relative error is no more than 0.05.
