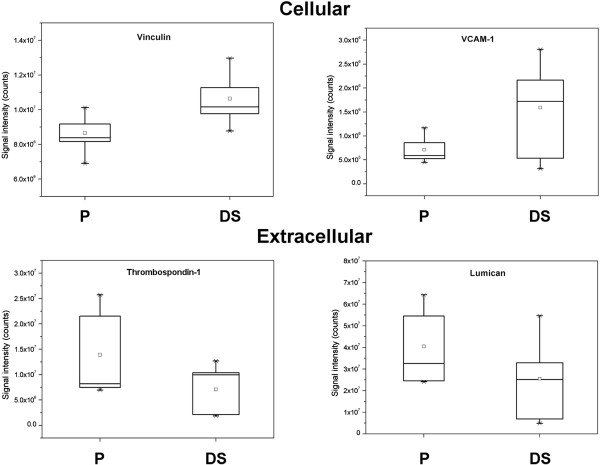
Figure 4.
Differential protein expression obtained by mass spectrometric analysis of P and DS. Four of the 31 proteins reported in table 3 are chosen and comparative expression analysis is presented as Box plots. Box plots show median value, standard deviation (SD), 50%, minimum and maximum intensity values and were exported from Marker View software.

