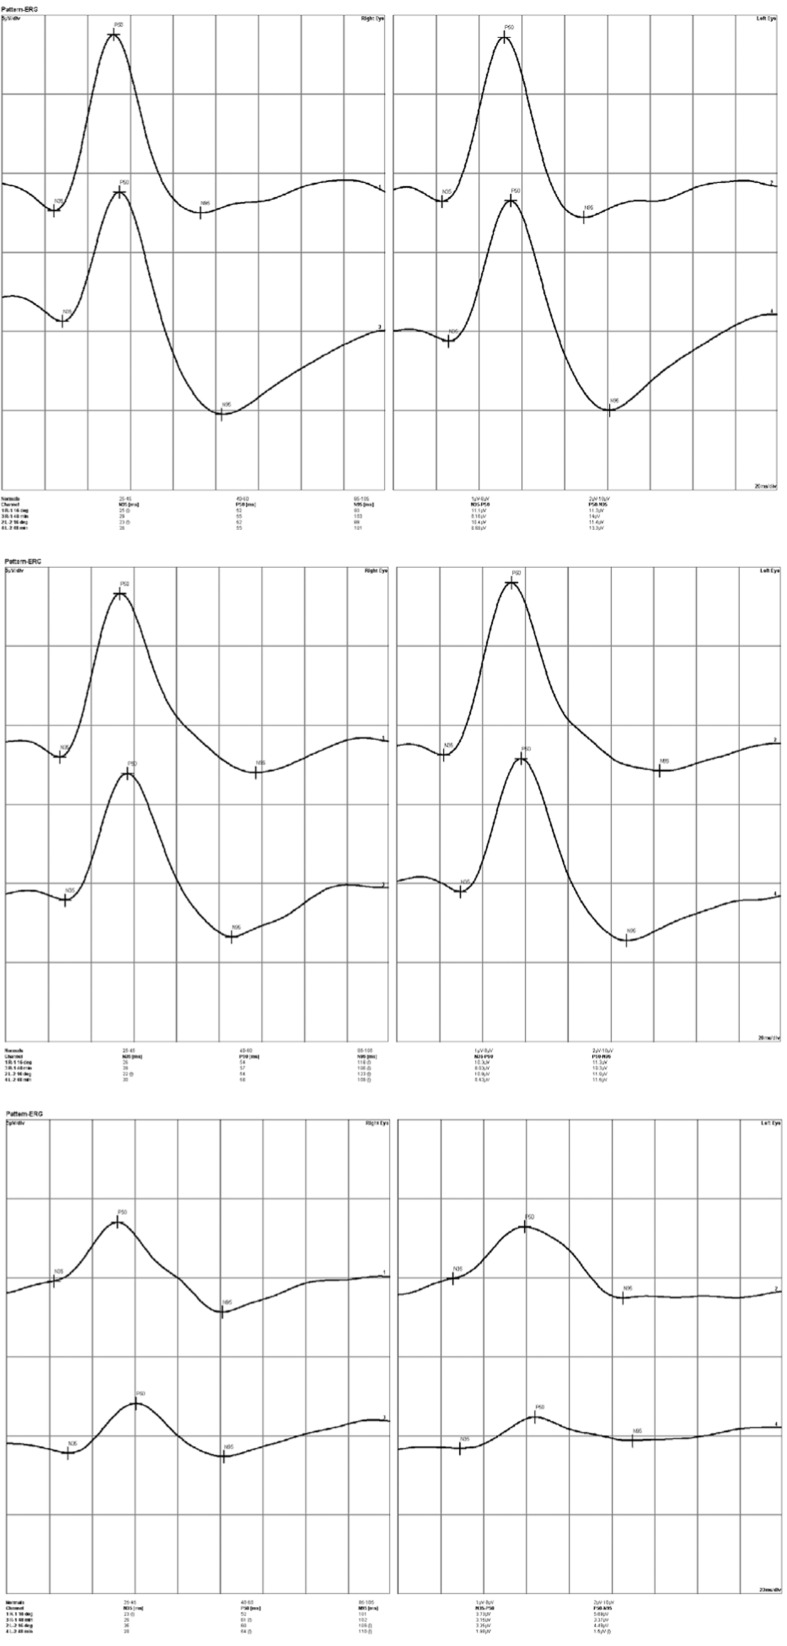
Figure 1.
Pattern electroretinographic (PERG) tracings of the right and left eyes (left and right columns, respectively) in three representative cases. Within each printout the upper tracing represents the PERG response to large (16 degree) checks while the lower tracing is the response to small (0.8 degree) checks. Upper image set, PERG in a normal control, note the amplitude and peak time of the P50 and N95 waves; middle image set, PERG tracings in a glaucoma suspect, note the increased latency despite normal amplitudes; lower image set, PERG tracings in a case of early manifest glaucoma, note both the increased latency and reduced amplitude of both waves.

