
Figure 1.
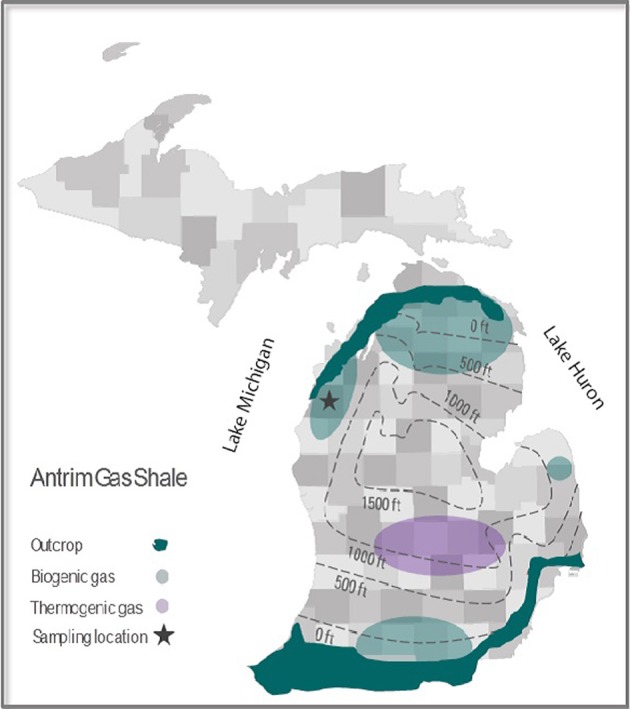
County map of the Antrim gas shale formation with average depth contours, outcrops, and major biogenic and thermogenic production regions delineated. The location of the wells sampled for this study is also shown.
Official websites use .gov
A
.gov website belongs to an official
government organization in the United States.
Secure .gov websites use HTTPS
A lock (
) or https:// means you've safely
connected to the .gov website. Share sensitive
information only on official, secure websites.
County map of the Antrim gas shale formation with average depth contours, outcrops, and major biogenic and thermogenic production regions delineated. The location of the wells sampled for this study is also shown.