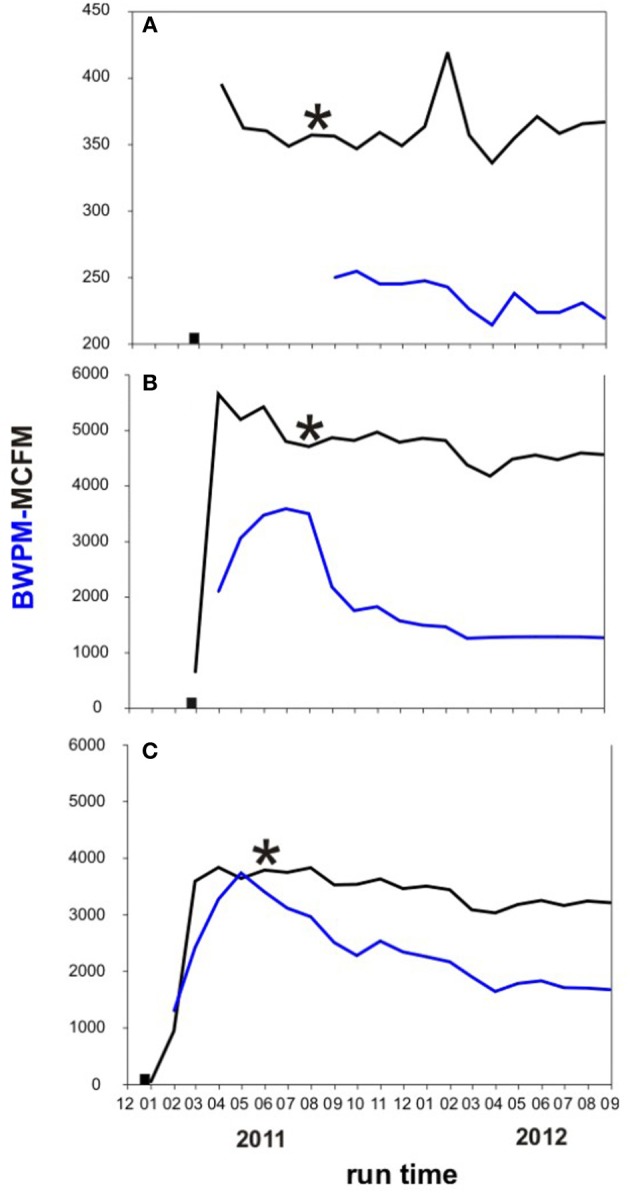
Figure 2.

Monthly water and gas production in the three investigated wells. Black: Thousand cubic feet gas per month (MCFM). Blue: barrels of water per month (BWPM). Black square: time when well was fractured. Black asterisk: time when formation water was sampled for this study. (A) A3-11 well; (B) B1-12 well; (C) C1-12 well.
