Figure 3.

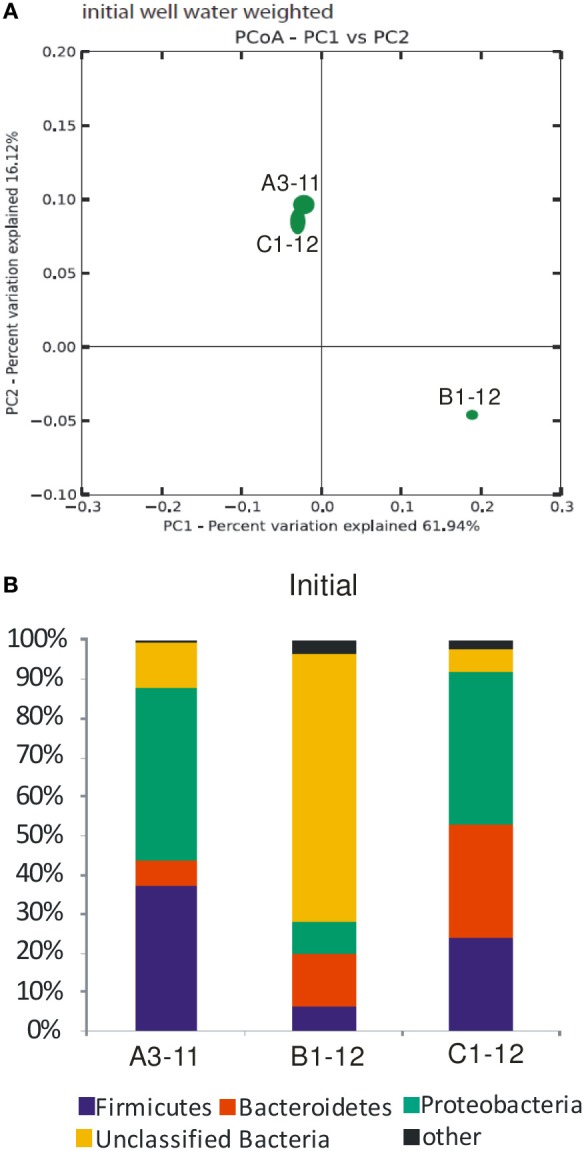
General overview of the prokaryotic diversity in the initial well waters. (A) Jackknifed PCoA plot of initial well water samples with weighted Unifrac. Shown is a plot of the first two principal coordinate axes, which combined explain 78% of the variation. Ellipses represent the interquartile range of the distribution of points among the 10 jackknifed replicates. (B) Relative abundance (% of Illumina reads) of the major bacterial phyla. A more detailed overview of the most abundant unclassified bacteria is shown in Supplementary Figure S3. “Other”; euryarchaota which comprised up to 1.3% of total Illumina reads with the remainder being less abundant bacteria (mainly OP9 and Spirochaeta).
