
Figure 1.
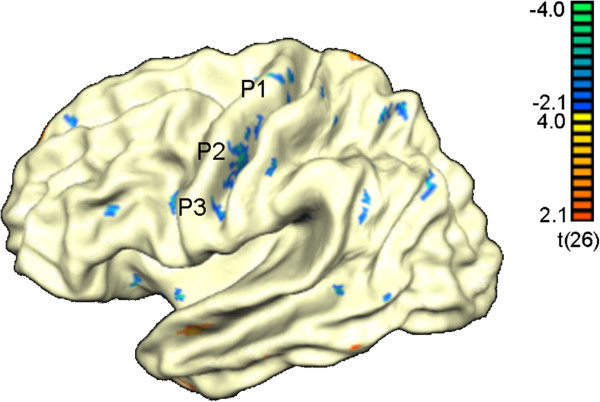
Results from the whole cortex analysis. Areas with significant thinning in ALS are depicted blue whereas areas with increased cortical thickness are shown in red. P1, P2, P3 refer to patches of interest described further in Figure 2.
Official websites use .gov
A
.gov website belongs to an official
government organization in the United States.
Secure .gov websites use HTTPS
A lock (
) or https:// means you've safely
connected to the .gov website. Share sensitive
information only on official, secure websites.
Results from the whole cortex analysis. Areas with significant thinning in ALS are depicted blue whereas areas with increased cortical thickness are shown in red. P1, P2, P3 refer to patches of interest described further in Figure 2.