. 2013 Oct-Dec;18(4):136–142. doi: 10.4103/0971-9261.121113
Copyright: © Journal of Indian Association of Pediatric Surgeons
This is an open-access article distributed under the terms of the Creative Commons Attribution-Noncommercial-Share Alike 3.0 Unported, which permits unrestricted use, distribution, and reproduction in any medium, provided the original work is properly cited.
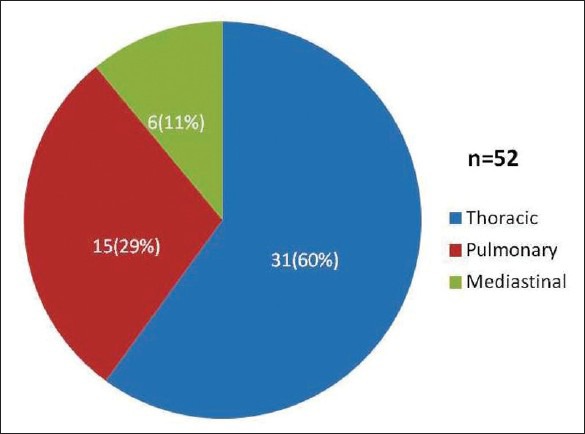
Figure 1.

Distribution of cases within each group
