
Figure 1.
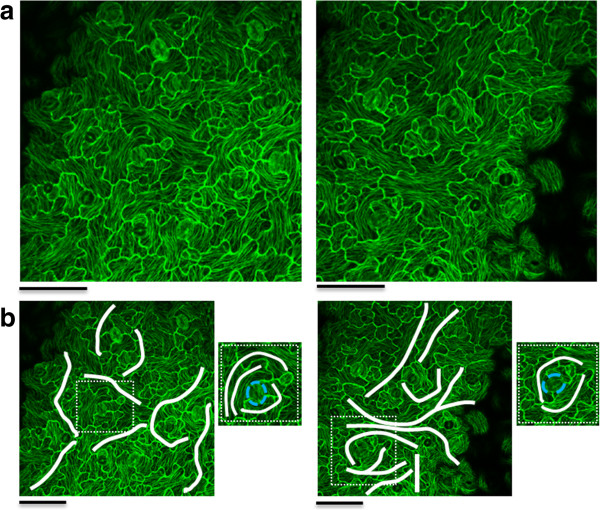
Supracellular patterns. Two example images of a supracellular microtubule stress pattern (a). The continuous patterns visible on these images are marked in white lines on the images in b. The zoomed sections show circular supracellular patterns around stomata (marked by blue dotted line). (scale bar = 50 μm).