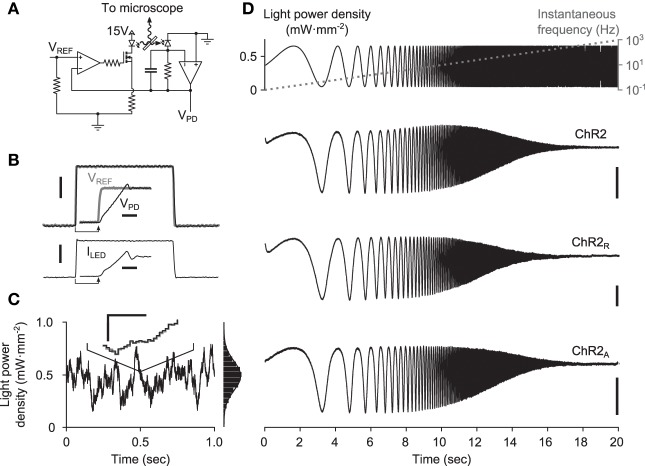
Figure 3.
Delivery of continuously-varying stimuli to neurons using ChR2. (A) Simplified schematic of the LED driver in optical feedback mode. The circuit uses an amplified photodiode to compensate for the non-linearities and temperature dependence of the LED, allowing arbitrary waveforms to be delivered to cells. (B) A 1-ms LED pulse, VPD (black), versus the reference voltage, VREF (gray). The current sourced to the LED is shown in the lower plot. Scale bars, 1 mW·mm−2 (top) and 250 mA (bottom). Insets show the zoomed step onset with corresponding 5 μs scale bars. (C) A computer generated Gaussian stimulus (gray) signal and the recorded light waveform (black). The lines overlap almost perfectly, making the reference voltage (gray) difficult to see. An inset shows a zoomed portion of the sequence. Scale bars, 0.05 mW·mm−2 and 500 μs. An amplitude histogram of the sequence, with a best-fit Gaussian distribution, is shown to the right. (D) Responses to frequency chirp stimuli for each ChR2 variant tested. The top plot shows the stimulus waveform (black) along with the instantaneous frequency profile (gray) and bottom plots show evoked current waveforms. Scale bars, 100 pA.

