Figure 1.
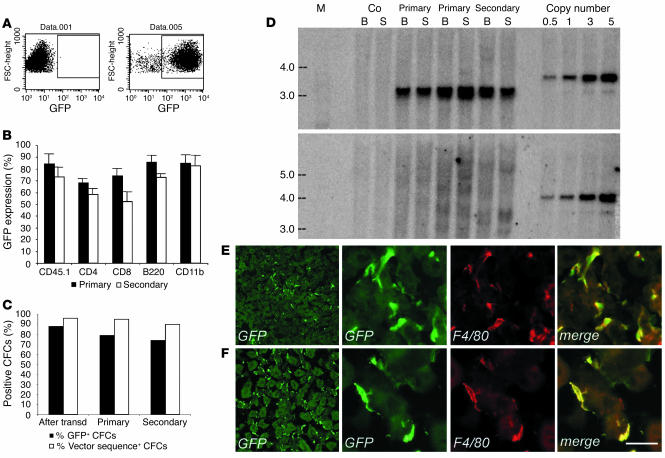
Chimerism and hematologic reconstitution by transgene-expressing cells of transplanted mice. (A) FACS analysis of GFP expression in control (left panel) and transduced (right panel) purified progenitors. (B) GFP expression in PBMCs of primary and secondary transplanted mice, 3 months after BMT. Up to 90% of circulating donor CD45.1-, CD11b-, B220-, CD4-, and CD8-positive cells expressed GFP. The means and standard deviations of primary (n =16) and secondary (n = 4) mice are shown. (C) GFP expression by fluorescence microscopy (% GFP+) and transduction level by PCR (% vector sequence+), in CFCs from progenitors after transduction and from BM of primary and secondary recipients (50–100 CFCs scored for fluorescence and 20 CFCs analyzed by PCR per each mouse, n = 9). The great majority of CFCs contained LV sequences and expressed GFP along serial transplants. (D) Southern blot analysis of bone marrow (B) and spleen (S) DNA from transplanted mice. A standard plasmid curve, from 0.5 to 5 vector copies per genome, DNA markers (M) in kb, and control untransplanted mice (Co) are shown. AflII digestion (upper panel) showed 5 or more vector copies integrated per cell in all recipients. BamHI digestion (lower panel) showed a diffuse hybridization pattern in primary mice indicating oligo- to polyclonal engraftment and the absence of dominant clones. (E) and (F) GFP+ cells in liver (E) and kidney (F) sections of transplanted mice, 3 months after BMT, stained as indicated. GFP+ cells expressed F4/80 (3 panels on the right). Scale bar: 20 μm.

