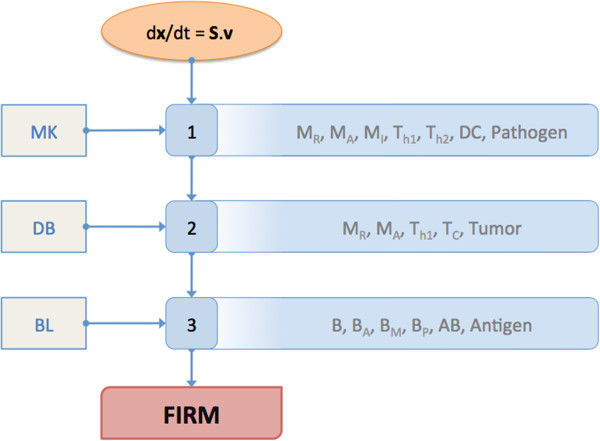
Figure 1.

The reconstructed FIRM network. A. The final FIRM formulation includes inactive fluxes and nodes that are included for completeness in this figure. Symbols are as follows: TUMOR, tumor mass; DEBRIS, tumor cell debris; MAPC, antigen-presenting macrophages; MA, activated macrophages; MR, resting macrophages; MI, infected macrophages; PI, intracellular bacteria; PE, extracellular bacteria; IDC, immature dendritic cells; MDC, mature dendritic cells; T, naïve T-cells; TCP, cytotoxic precursor T-cells; TC, cytotoxic T-cells; THP, helper precursor T-calls TH1, T-helper 1 cells; TH2, T-helper 2 cells; AB, antibody; B, naïve B-cells; BA, activated B-cells; BM, memory B-cells; BP, plasma B-cells; Treg, regulatory T-cells. See the Supplemental Material for the full details. B. The cytokine activity of the FIRM network. Solid green arrows represent production. Dashed green arrows represent up-regulation of a flux, and dashed red arrows represent down-regulation of a flux. The graph is a superset of Figure 1A, where cytokines are superimposed to the previously defined cell populations. Symbols are as follows: I12, interleukin-12; Iγ, interferon-gamma; I10, interleukin-10; I4, interleukin 4; TGF-β, tumor growth factor beta.
