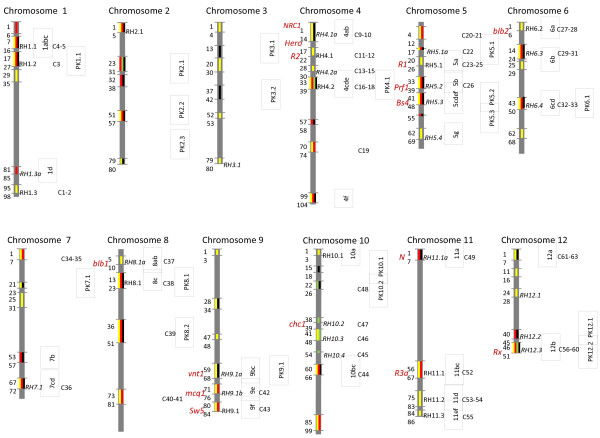
Figure 1.
Genetic map of RGA clusters in the potato genome. The twelve chromosomes of potato are depicted. Bin ranges corresponding to the potato UHD map of RH are indicated by horizontal lines. Profiling markers in these bin ranges are identified with NBS, N-like, CDPchc1, or PK primers as indicated by yellow, red, green and black bars, respectively. The RHx.y label, on the right side of the chromosome cartoons, indicates RGA clusters as identified using NBS profiling by Brugmans et al. [27]. RGA clusters identified by profiling in this study are indicated as RHx.y labels (italic font). In the vertical text boxes, is the RGA cluster name given by Bakker et al. [33] In the second horizontal text boxes, the corresponding NLR cluster names, as provided by Jupe et al. [34] are given. In the second vertical text boxes, the names of clusters of confirmed PK sequences, as determined in this study, are provided. Positions of known R gene clusters, as derived from Bakker et al. [33] are indicated by red font.

