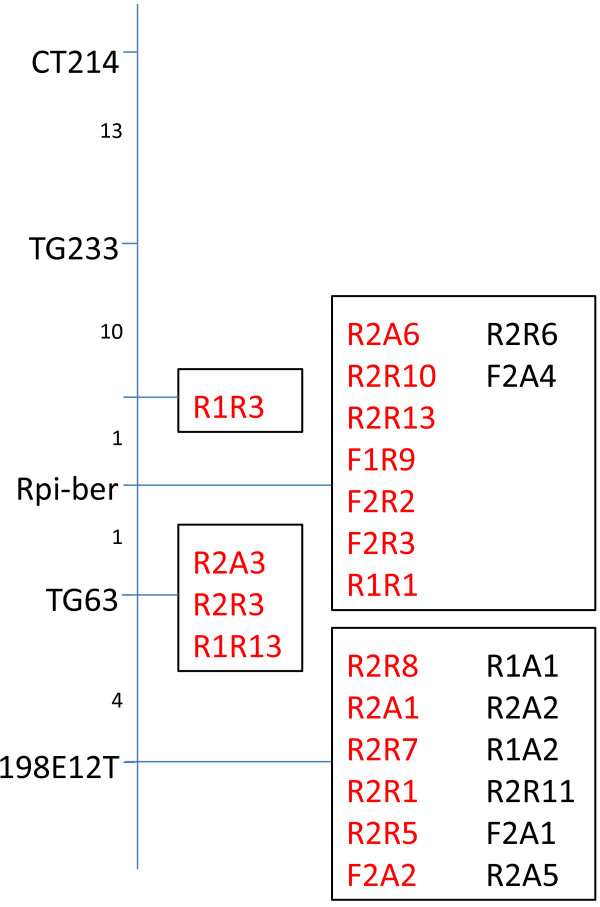
Figure 2.
Genetic map of the Rpi-ber gene. Known CAPS markers are shown on the left side. On the right side, the CDPchc1 markers are shown. Numbers between horizontal lines represent the numbers of recombinants in an F1 population with 1,771 individuals. Marker names in red font are in trans-phase, while markers in black font are in cis-phase.

