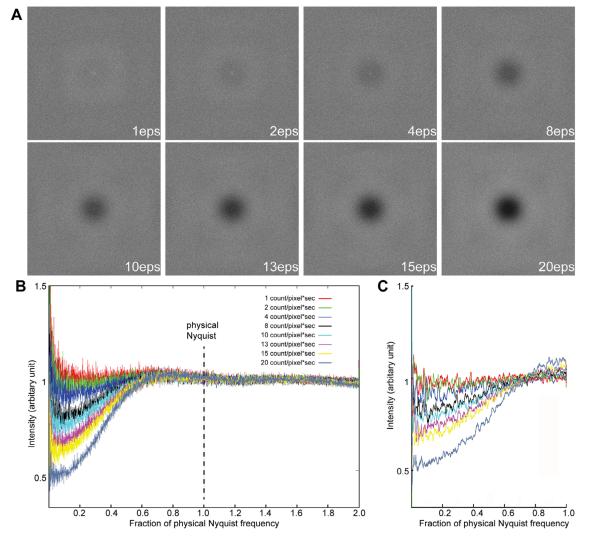
Fig.2.
Influence of dose rate on counting images (A) Fourier transforms of empty super-resolution counting images recorded with different dose rates. Exposure time was adjusted so that the total dose used in each image is the same. The edge of the transform corresponds to twice the physical Nyquist limit. (B) Rotational averages of power spectra from empty counting images, i.e. noise power spectra, were plotted in different colors. (C) Simulated noise power spectra at different dose rates.

