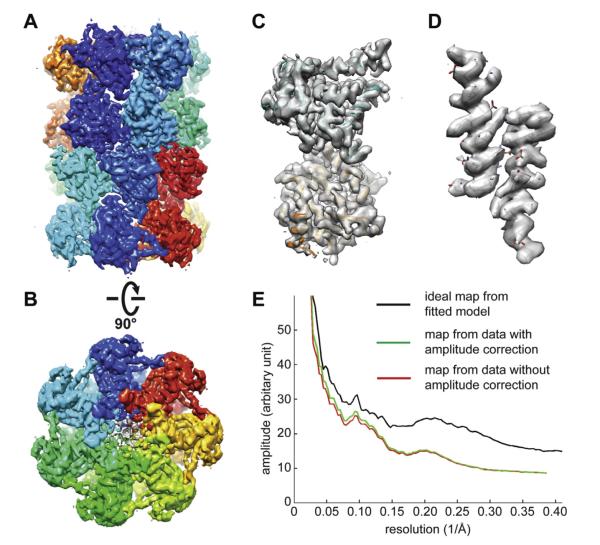
Fig.6.
3D reconstruction of archaeal 20S proteasome with amplitude correction. 10,000 particles were taken from previously published dataset (Li et al., 2013) and corrected for coincidence loss induced low frequency amplitude loss. (A and B) Two different views of the 3D reconstruction after amplitude correction filtered to a resolution of 3.6 Å. (C) A single α- and β-subunits segmented from the 3D density map in A. (D) Two α-helices segmented from the α- and β-subunits showing clear side chain density. The quality of side chain density is similar to the published 3.3 Å map (Li et al., 2013). (E) Comparison of rotational averages of Fourier power spectra of the 3D reconstructions with (red) and without (green) amplitude correction.

