
Figure 5. Energy consumption with spike initiation at the soma and in the axon.
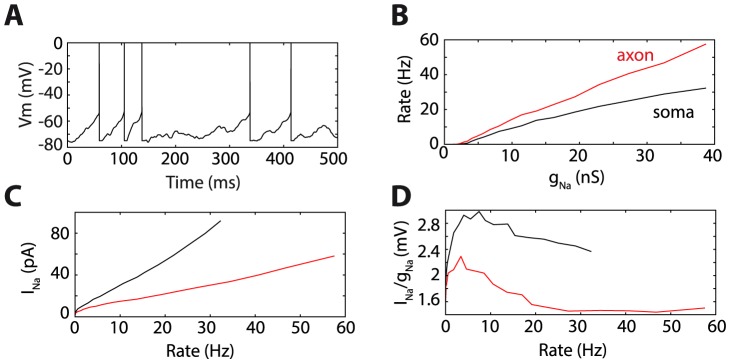
A, Response of the neuron model with Na channels at 40 µm away from the soma to a fluctuating current injected at the soma. Since there are only Na channels in the model, the membrane potential is reset when half of Na channels are open (spikes are added to the trace for readability). B, Firing rate as a function of maximum Na conductance, when channels are in the axon (red, 40 µm from the soma) and at the soma (black). C, Average Na current as a function of output firing rate, for both cases. D, Same as C, but normalized by the maximum Na conductance (essentially reflecting the average proportion of open channels).