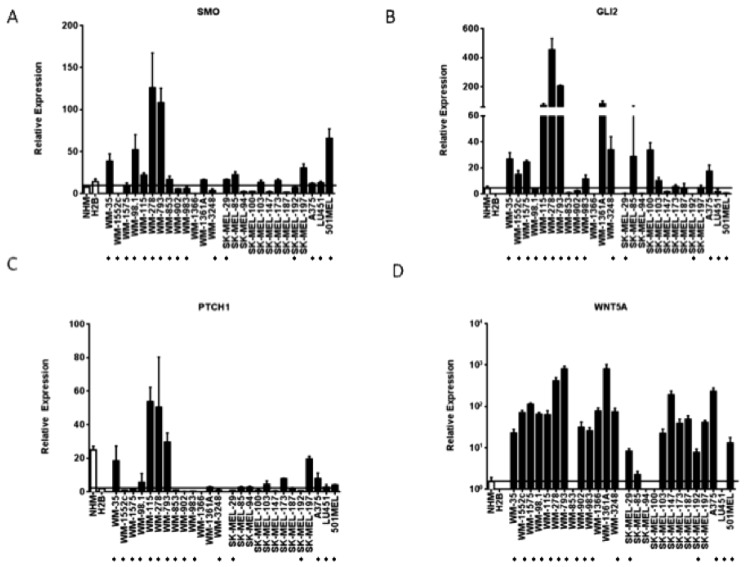
Figure 2.
Hedgehog pathway members are upregulated in a subset of melanoma cell lines. (A–D) Elevated transcript levels of SMO, GLI2, PTCH1, and WNT5a detected by Affymetrix microarray analysis were confirmed by quantitative RT-PCR. Values represent the mean ± standard deviation of triplicate qPCRs from three different experiments. Open bars represent melanocytes controls, while the closed bars represent melanoma cell lines. The cell lines beginning with “WM” are primary melanoma cell lines, while the cells lines beginning with “SK-MEL” and the A375, LU451, and 501MEL cell lines are metastatic melanoma cell lines. (*) Indicates that the cell line is a V600E B-RAF mutant.

