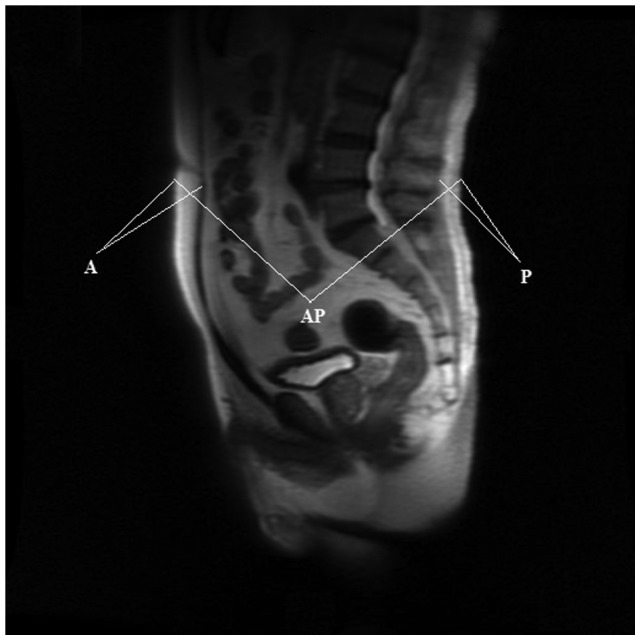
Figure 1.

Representation of the T2-weighted sagittal localisation images from MRI. A, P and AP were measured in three images around the midline, and the results were averaged. A, anterior abdominal fat; AP, anteroposterior diameter; MRI, magnetic resonance imaging; P, posterior abdominal fat.
