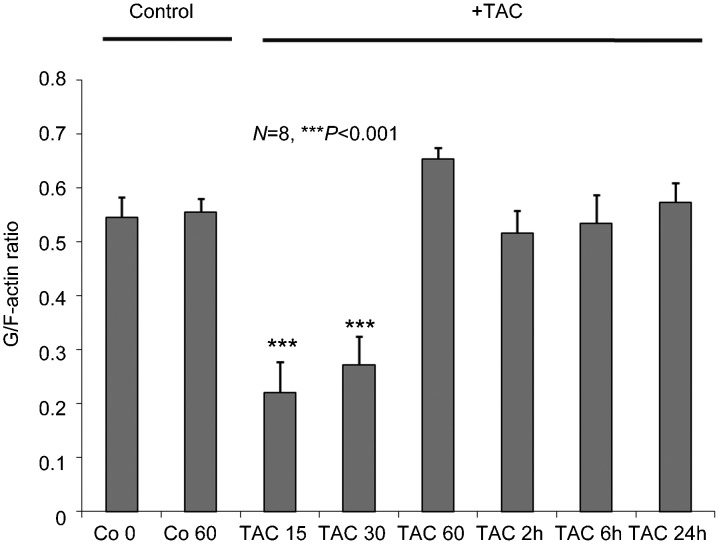
Figure 1.
Modulation of the dynamic equilibrium between G- and Total actin in testosterone-HSA stimulated Caco2 cells. Twenty-four hour serum starved cells were stimulated with 10−7 mol l−1 TAC for the indicated time points. Total and G- actin were measured by quantitative immunoblot analysis after Triton X-100 subcellular fractionation. Bars present the G/Total actin (mean±s.e.) of n=8 independent duplicate experiments (***P<0.001, compared with control). TAC, testosterone albumin conjugate.

