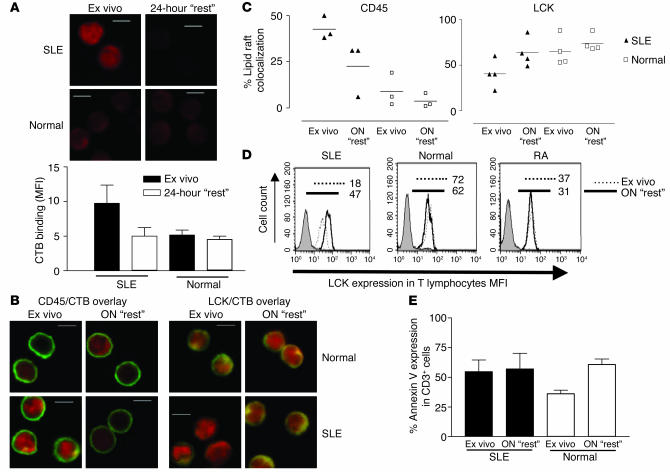
Figure 5.
In vitro culture of SLE T cells normalizes expression of GM1 and LCK. T lymphocytes from four patients with SLE and four healthy volunteers (Normal) were analyzed by confocal microscopy either ex vivo or after overnight (ON) “rest”. (A) Representative microscopy images showing CTB binding in SLE and normal T cells analyzed ex vivo and after 24 hours of “rest” (upper panels). The CTB binding intensity, measured by MFI (± SEM), in three representative images from three patients with SLE and three healthy controls is shown (lower panel). (B) Representative microscopy images showing CD45/CTB and LCK/CTB colocalization in SLE and normal T cells analyzed ex vivo and after 24 hours of “rest”. In A and B: scale bars, 5 μm; X on confocal images represents position of activating bead. (C) Semiquantitative results from four patients with SLE and four healthy controls. On average, 25 cells from each sample were assessed for areas of CD45/CTB or LCK/CTB colocalization. (D) The effect of overnight “rest” on T cell LCK expression was measured by flow cytometry. T cells (106) were stained with anti-CD3–PE followed by rabbit anti-LCK or isotype control and FITC-conjugated anti–mouse Ig. Results are expressed as MFI. Figure is representative of three experiments. Numbers indicate MFI. (E) T cell apoptosis was assessed in five patients with SLE and five healthy controls. Cells were labeled with annexin V-FITC and propidium iodide and were analyzed by flow cytometry. Results are expressed as percent of CD3+ cells expressing annexin V (mean ± SEM).

