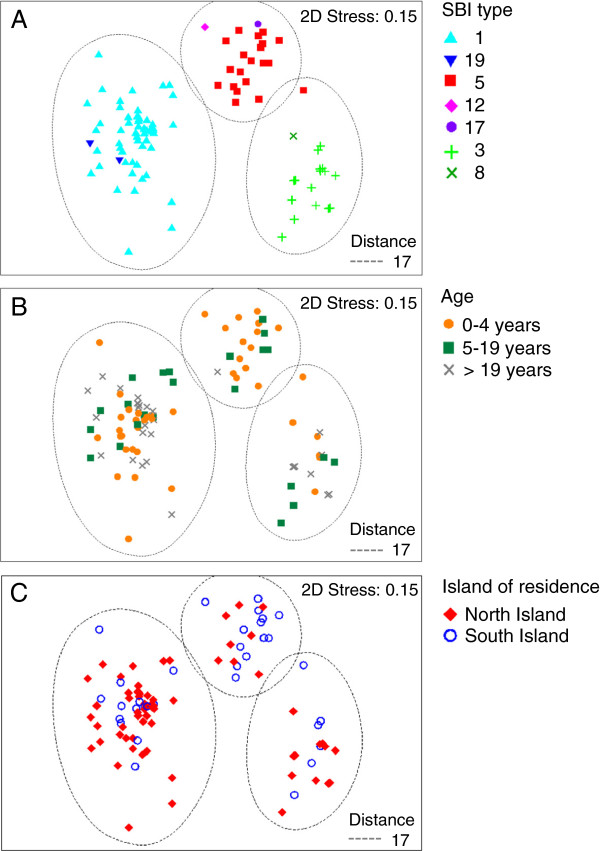
Figure 5.
Multidimensional scaling plots (MDS). MDS showing the genotypic clustering of E. coli O157:H7 human isolates and (A) Shiga toxin-encoding bacteriophage insertion (SBI) types; (B) age categories; and (C) island of residence. The three clusters of isolates share a genetic difference of 17% (Distance = 17) based on the isolates’ PFGE profiles.

