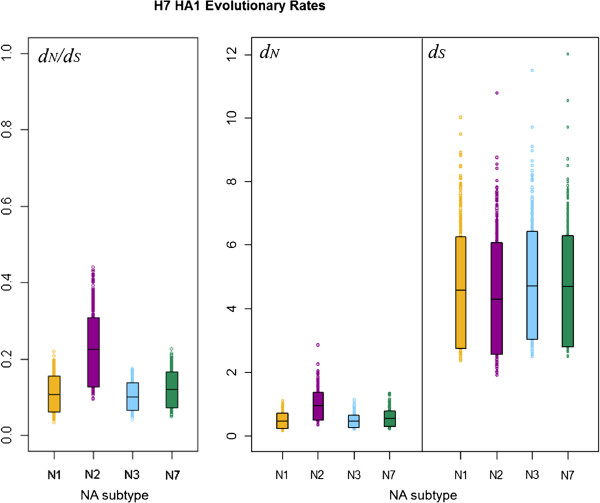
Figure 2.
90% HPD plots for H7 HA1 evolutionary rates, split by viral NA subtype. The boxes show the limits of the narrowest interval containing 90% of the estimates. The horizontal lines inside the boxes indicate the location of the mean for each subtype. Individual points shown outside the boxes are values which lie below the lower limit, or above the upper limit, of the 90% HPD interval. For each subtype, values for dS are the number of synonymous changes per synonymous site, scaled by the total branch lengths in the tree sample for lineages corresponding to that subtype. Similarly, dN is given in terms of the number of non-synonymous changes per non-synonymous site, scaled by the total branch lengths in the tree sample for lineages corresponding to that subtype.

