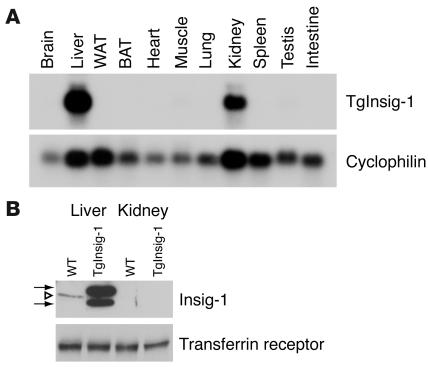
Figure 1.
Transgene expression in TgInsig-1 mice. (A) Tissue distribution of human Insig-1 transgene mRNA. Total RNA was extracted from tissues of transgenic mice consuming a chow diet. A total of 20 μg of RNA was subjected to electrophoresis and blot hybridization with 32P-labeled cDNA probes for human Insig-1 and mouse cyclophilin. After stringent washing, the membranes were exposed to Kodak X-Omat Blue XB-1 films for 4–12 hours at –80°C. (B) Immunoblot analysis of endogenous mouse Insig-1 and transgenic human Insig-1 from the livers and kidneys of WT and TgInsig-1 mice, respectively. Membrane fractions from five WT and five TgInsig-1 mice (same as those described in Table 1) were prepared and pooled as described in Methods. Aliquots of the pooled membrane fraction (45 μg protein) were subjected to SDS-PAGE and immunoblot analysis as described in Methods. Filters were exposed to Kodak X-Omat Blue XB-1 film for 15 seconds at room temperature. Open triangle denotes endogenous mouse Insig-1 (28 kDa); arrows denote transgenic human Insig-1 (doublet of 30 kDa and 26 kDa). Immunoblot of transferrin receptor served as a loading control. WAT, white adipose tissue; BAT, brown adipose tissue.

